Specifications
- Plate, Sheet & Strip: AMS 5878, ASME SB435
- Rod & Bar: AMS 5891, ASME SB572
- Seamless Pipe & Tube: ASME SB622
- Fittings: ASME SB366
- Forgings: AMS 5891, ASME SB564

Haynes® 230 is a high-performance nickel alloy recognized for its strength, oxidation resistance and stability at extreme temperatures. Nickel Systems offers an extensive inventory of Haynes® 230 fasteners ready for immediate shipment. As a true stocking distributor, we make sourcing exotic alloy fasteners fast and efficient, backed by deep expertise and responsive support. Our Haynes® 230 fasteners perform reliably in corrosive and high-heat environments across aerospace, chemical processing, power generation and other applications.
The tables below summarize Haynes® 230’s primary physical, mechanical and chemical properties. For detailed information, download the full technical data sheet.
This technical data is specifically related to Haynes®230 produced by Haynes International. Haynes® 230 is a trademark of Haynes International. For more information, visit the Haynes International website. If you require this specific material, you must request it at the time of quotation.
| Physical Property | Imperial Units | Metric Units | ||
| Density | RT | 0.314 lb/in3 | RT | 8.69 g/cm3 |
| Melting Temp. | 2375-2500°F | — | 1301-1371°C | — |
| Electrical Resistivity | RT | 49.2 μ0hm.in | RT | 125.0 μ0hm.m |
| 200°F | 49.5 μ0hm.in | 100°C | 125.8 μ0hm.m | |
| 400°F | 49.8 μ0hm.in | 200°C | 126.5 μ0hm.m | |
| 600°F | 50.2 μ0hm.in | 300°C | 127.3 μ0hm.m | |
| 800°F | 50.7 μ0hm.in | 400°C | 128.4 μ0hm.m | |
| 1000°F | 51.5 μ0hm.in | 500°C | 130.2 μ0hm.m | |
| 1200°F | 51.6 μ0hm.in | 600°C | 131.2 μ0hm.m | |
| 1400°F | 51.5 μ0hm.in | 700°C | 130.7 μ0hm.m | |
| 1600°F | 50.3 μ0hm.in | 800°C | 129.1 μ0hm.m | |
| 1800°F | 49.3 μ0hm.in | 900°C | 127.1 μ0hm.m | |
| — | — | 1000°C | 125.0 μ0hm.m | |
| Thermal Conductivity | RT | 62 btu.in/h.ft2.°F | RT | 8.9 W/m.°C |
| 200°F | 71 btu.in/h.ft2.°F | 100°C | 10.4 W/m.°C | |
| 400°F | 87 btu.in/h.ft2.°F | 200°C | 12.4 W/m.°C | |
| 600°F | 102 btu.in/h.ft2.°F | 300°C | 14.4 W/m.°C | |
| 800°F | 118 btu.in/h.ft2.°F | 400°C | 16.4 W/m.°C | |
| 1000°F | 133 btu.in/h.ft2.°F | 500°C | 18.4 W/m.°C | |
| 1200°F | 148 btu.in/h.ft2.°F | 600°C | 20.4 W/m.°C | |
| 1400°F | 164 btu.in/h.ft2.°F | 700°C | 22.4 W/m.°C | |
| 1600°F | 179 btu.in/h.ft2.°F | 800°C | 24.4 W/m.°C | |
| 1800°F | 195 btu.in/h.ft2.°F | 900°C | 26.4 W/m.°C | |
| — | — | 1000°C | 28.4 W/m.°C | |
| Thermal Diffusivity | RT | 3.8 x 10⁻³in2/sec | RT | 24.2 x 10⁻³cm2/s |
| 200°F | 4.1 x 10⁻³in2/sec | 100°C | 26.8 x 10⁻³cm2/s | |
| 400°F | 4.7 x 10⁻³in2/sec | 200°C | 29.9 x 10⁻³cm2/s | |
| 600°F | 5.2 x 10⁻³in2/sec | 300°C | 32.9 x 10⁻³cm2/s | |
| 800°F | 5.6 x 10⁻³in2/sec | 400°C | 35.7 x 10⁻³cm2/s | |
| 1000°F | 6.1 x 10⁻³in2/sec | 500°C | 38.5 x 10⁻³cm2/s | |
| 1200°F | 6.5 x 10⁻³in2/sec | 600°C | 41.9 x 10⁻³cm2/s | |
| 1400°F | 6.7 x 10⁻³in2/sec | 700°C | 43.0 x 10⁻³cm2/s | |
| 1600°F | 6.7 x 10⁻³in2/sec | 800°C | 43.2 x 10⁻³cm2/s | |
| 1800°F | 7.3 x 10⁻³in2/sec | 900°C | 44.4 x 10⁻³cm2/s | |
| — | — | 1000°C | 48.2 x 10⁻³cm2/s | |
| Mean Coefficient of Thermal Expansion | 70-200°F | 6.5 μin/in. °F | 25-100°C | 11.8 x 10⁻⁶m/m.°C |
| 70-400°F | 6.9 μin/in. °F | 25-200°C | 12.4 x 10⁻⁶m/m.°C | |
| 70-600°F | 7.2 μin/in. °F | 25-300°C | 12.8 x 10⁻⁶m/m.°C | |
| 70-800°F | 7.4 μin/in. °F | 25-400°C | 13.2 x 10⁻⁶m/m.°C | |
| 70-1000°F | 7.6 μin/in. °F | 25-500°C | 13.6 x 10⁻⁶m/m.°C | |
| 70-1200°F | 8.0 μin/in. °F | 25-600°C | 14.1 x 10⁻⁶m/m.°C | |
| 70-1400°F | 8.3 μin/in. °F | 25-700°C | 14.7 x 10⁻⁶m/m.°C | |
| 70-1600°F | 8.6 μin/in. °F | 25-800°C | 15.2 x 10⁻⁶m/m.°C | |
| 70-1800°F | 8.9 μin/in. °F | 25-900°C | 15.7 x 10⁻⁶m/m.°C | |
| — | — | 25-1000°C | 16.1 x 10⁻⁶m/m.°C | |
| Specific Heat | 100°F | 0.095 Btu/lb.°F | 100°C | 397 J/kg.°C |
| 200°F | 0.099 Btu/lb.°F | 200°C | 419 J/kg.°C | |
| 400°F | 0.104 Btu/lb.°F | 300°C | 435 J/kg.°C | |
| 600°F | 0.108 Btu/lb.°F | 400°C | 448 J/kg.°C | |
| 800°F | 0.112 Btu/lb.°F | 500°C | 465 J/kg.°C | |
| 1000°F | 0.112 Btu/lb.°F | 600°C | 473 J/kg.°C | |
| 1200°F | 0.134 Btu/lb.°F | 700°C | 486 J/kg.°C | |
| 1400°F | 0.140 Btu/lb.°F | 800°C | 574 J/kg.°C | |
| 1600°F | 0.145 Btu/lb.°F | 900°C | 595 J/kg.°C | |
| 1800°F | 0.147 Btu/lb.°F | 1000°C | 609 J/kg.°C | |
| — | — | 1000°C | 617 J/kg.°C | |
| Dynamic Modulus of Elasticity | RT | 30.3 x 10⁶ psi | RT | 209 GPa |
| 200°F | 30.1 x 10⁶ psi | 100°C | 207 GPa | |
| 400°F | 29.0 x 10⁶ psi | 200°C | 200 GPa | |
| 600°F | 27.8 x 10⁶ psi | 300°C | 193 GPa | |
| 800°F | 26.8 x 10⁶ psi | 400°C | 186 GPa | |
| 1000°F | 25.9 x 10⁶ psi | 500°C | 181 GPa | |
| 1200°F | 24.9 x 10⁶ psi | 600°C | 175 GPa | |
| 1400°F | 23.6 x 10⁶ psi | 700°C | 168 GPa | |
| 1600°F | 22.2 x 10⁶ psi | 800°C | 159 GPa | |
| 1800°F | 20.7 x 10⁶ psi | 900°C | 150 GPa | |
| 2000°F | 19.1 x 10⁶ psi | 1000°C | 141 GPa | |
| Dynamic Shear Modulus | RT | 11.5 x 10⁶ psi | RT | 79 GPa |
| 200°F | 11.4 x 10⁶ psi | 100°C | 79 GPa | |
| 400°F | 11.0 x 10⁶ psi | 200°C | 76 GPa | |
| 600°F | 10.5 x 10⁶ psi | 300°C | 73 GPa | |
| 800°F | 10.1 x 10⁶ psi | 400°C | 70 GPa | |
| 1000°F | 9.7 x 10⁶ psi | 500°C | 67 GPa | |
| 1200°F | 9.3 x 10⁶ psi | 600°C | 64 GPa | |
| 1400°F | 8.8 x 10⁶ psi | 700°C | 61 GPa | |
| 1600°F | 8.2 x 10⁶ psi | 800°C | 57 GPa | |
| 1800°F | 7.6 x 10⁶ psi | 900°C | 52 GPa | |
| 2000°F | 7.0 x 10⁶ psi | 1000°C | 48 GPa | |
| Poisson’s Ratio | RT | 0.31 | RT | 0.31 |
| 200°F | 0.31 | 100°C | 0.31 | |
| 400°F | 0.32 | 200°C | 0.32 | |
| 600°F | 0.32 | 300°C | 0.32 | |
| 800°F | 0.33 | 400°C | 0.33 | |
| 1000°F | 0.33 | 500°C | 0.33 | |
| 1200°F | 0.34 | 600°C | 0.34 | |
| 1400°F | 0.34 | 700°C | 0.34 | |
| 1600°F | 0.35 | 800°C | 0.34 | |
| 1800°F | 0.36 | 900°C | 0.35 | |
RT= Room Temperature
| Test Temperature | 0.2% Yield Strength | Ultimate Tensile Strength | Elongation | |||
| °F | °C | ksi | MPa | ksi | MPa | % |
| 70 | 21 | 60.4 | 417 | 121.4 | 837 | 47.3 |
| 1000 | 538 | 42.6 | 294 | 100.1 | 690 | 51.74 |
| 1200 | 649 | 42.2 | 291 | 96.6 | 666 | 56.9 |
| 1400 | 760 | 45.1 | 311 | 78.0 | 538 | 59.5 |
| 1600 | 871 | 34.2 | 236 | 44.6 | 308 | 74.2 |
| 1800 | 982 | 17.8 | 123 | 24.5 | 169 | 54.1 |
| 2000 | 1093 | 10.0 | 69 | 13.1 | 90 | 37.0 |
| Test Temperature | 0.2% Yield Strength | Ultimate Tensile Strength | Elongation | |||
| °F | °C | ksi | MPa | ksi | MPa | % |
| 70 | 21 | 55.5 | 383 | 123.6 | 852 | 46.0 |
| 1000 | 538 | 38.1 | 263 | 102.5 | 706 | 53.2 |
| 1200 | 649 | 38.7 | 267 | 98.2 | 677 | 53.0 |
| 1400 | 760 | 37.7 | 260 | 77.2 | 533 | 68.0 |
| 1600 | 871 | 33.9 | 234 | 45.1 | 311 | 94.0 |
| 1800 | 982 | 16.8 | 116 | 24.3 | 168 | 91.2 |
| 2000 | 1093 | 9.1 | 63 | 13.2 | 91 | 92.1 |
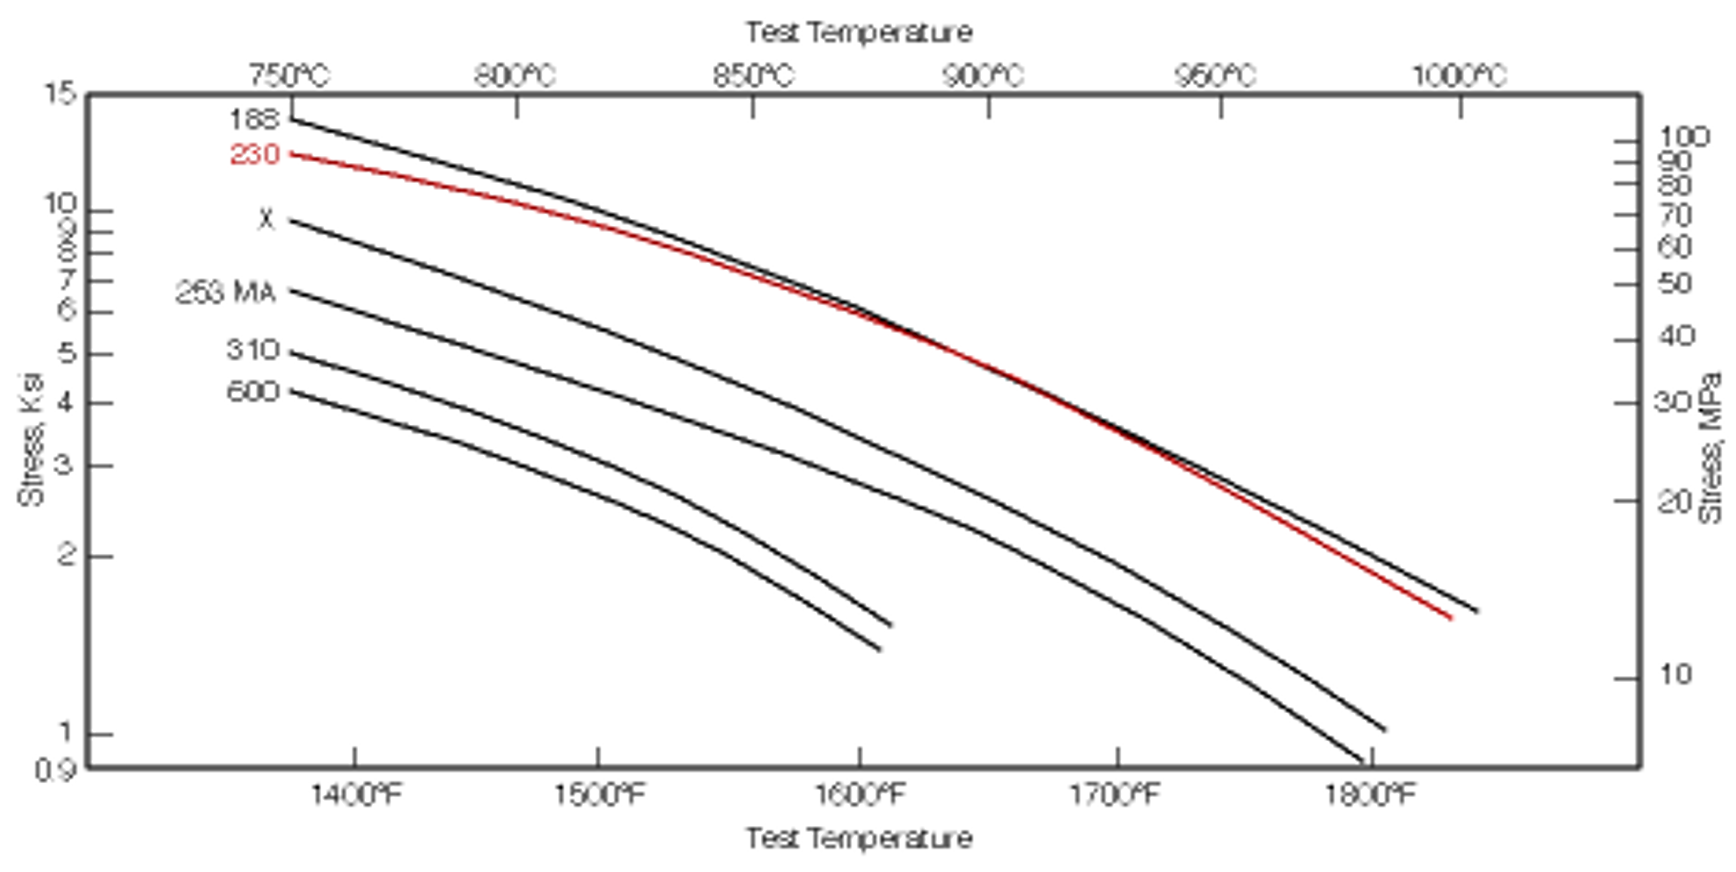
| Alloy | Hours to Rupture | ||
| 1400°F (760°C) | 1600°F (871°C) | 1800°F (982°C) | |
| 15.0 ksi (103 Mpa) | 4.1 ksi (31 Mpa) | 2.0 ksi (14 Mpa) | |
| 230® | 8,200 | 65,000 | 5,000 |
| 625 | 19,000 | 14,000 | 2,400 |
| X | 900 | 5,000 | 2,100 |
| 800H | 130 | 1,200 | 920 |
| INCONEL® 601 |
50 | 1,200 | 1,000 |
| 253 MA® | 140 | 900 | 720 |
| 600 | 15 | 280 | 580 |
| 316 SS | 100 | 240 | 130 |
| RA330® | 30 | 230 | 130 |
| 304 SS | 10 | 100 | 72 |
*Based upon Larson-Miller extrapolation
| Temperature | Creep | Approximate Initial Stress to Produce Specified Creep in | ||||||||
| 10 Hours | 100 Hours | 1,000 Hours | 10,000 Hours | |||||||
| °F | °C | % | ksi | MPa | ksi | MPa | ksi | MPa | ksi | MPa |
| 1200 | 649 | 0.5 | — | — | 31 | 214 | — | — | — | — |
| 1 | — | — | 35 | 241 | 24* | 165* | — | — | ||
| R | — | — | 51 | 352 | 36 | 248 | 28 | 193 | ||
| 1300 | 704 | 0.5 | 29 | 200 | 21 | 145 | 14.5 | 100 | — | — |
| 1 | 33 | 228 | 23 | 159 | 17 | 114 | — | — | ||
| R | 47 | 324 | 34 | 234 | 26 | 179 | 20 | 134 | ||
| 1400 | 760 | 0.5 | 19.2 | 132 | 13.7 | 94 | 9.6 | 66 | 7.3 | 50 |
| 1 | 21 | 145 | 15.5 | 107 | 11.5 | 79 | 8.6 | 59 | ||
| R | 32 | 221 | 24.5 | 169 | 18.2 | 125 | 13.2* | 91* | ||
| 1500 | 816 | 0.5 | 14.2 | 98 | 10.3 | 71 | 7.5 | 52 | 5.4* | 37* |
| 1 | 15 | 103 | 11.2 | 77 | 8.6 | 59 | 6.5* | 45* | ||
| R | 23* | 161* | 17.5 | 121 | 12.5 | 86 | 8.4* | 58* | ||
| 1600 | 871 | 0.5 | 11.3 | 78 | 8.1 | 56 | 5.7 | 39 | 4.0 | 28 |
| 1 | 11.7 | 81 | 9.0 | 62 | 6.2 | 43 | 4.3 | 30 | ||
| R | 17.0 | 117 | 12.5 | 86 | 8.2 | 57 | 5.6* | 39* | ||
| 1700 | 927 | 0.5 | 7.7 | 53 | 5.5 | 38 | 3.8 | 26 | 2.4* | 17* |
| 1 | 8.8* | 61* | 6.2 | 43 | 4.2 | 29 | 2.7* | 19* | ||
| R | 12.0* | 83* | 8.0 | 55 | 5.1 | 35 | 3.2 | 22 | ||
| 1800 | 982 | 0.5 | 7.0 | 48 | 3.6 | 25 | 1.8 | 12 | 0.85 | 5.9 |
| 1 | 8.0 | 55 | 4.1 | 28 | 2.0 | 14 | 1.0 | 6.9 | ||
| R | 10.0 | 69 | 5.4 | 37 | 2.6 | 18 | 1.2* | 8.3* | ||
| 1900 | 1038 | 0.5 | — | — | 1.7 | 12 | 0.8 | 5.5 | — | — |
| 1 | — | — | 2.0 | 14 | 0.9 | 6.2 | — | — | ||
| R | — | — | 3.0* | 21* | 1.5 | 10 | — | — | ||
| 2000 | 1093 | 0.5 | — | — | — | — | — | — | — | — |
| 1 | — | — | 0.9 | 6.2 | — | — | — | — | ||
| R | — | — | — | — | — | — | — | — | ||
*Significant Extrapolation
| Temperature | Creep | Approximate Initial Stress to Produce Specified Creep in | ||||||||
| 10 Hours | 100 Hours | 1,000 Hours | 10,000 Hours | |||||||
| °F | °C | % | ksi | MPa | ksi | MPa | ksi | MPa | ksi | MPa |
| 1200 | 649 | 0.5 | — | — | 35 | 241 | 23 | 159 | — | — |
| 1 | — | — | 39 | 269 | 26.5 | 183 | 17.5 | 121 | ||
| R | 75 | 517 | 56 | 386 | 41 | 283 | 29 | 200 | ||
| 1300 | 704 | 0.5 | 35 | 241 | 21.5 | 148 | 14.5 | 100 | — | — |
| 1 | 39 | 269 | 24.5 | 169 | 18 | 124 | 12.3* | 85* | ||
| R | 59 | 407 | 42 | 290 | 30 | 207 | 21 | 145 | ||
| 1400 | 760 | 0.5 | 19 | 131 | 13.5 | 93 | 10.0 | 69 | — | — |
| 1 | 23 | 159 | 15.9 | 110 | 11.5 | 79 | 9.0* | 62* | ||
| R | 37 | 255 | 27 | 186 | 20 | 138 | 14.2 | 98 | ||
| 1500 | 816 | 0.5 | 14.0 | 97 | 10.4 | 72 | 8.2 | 57 | 6.1 | 42 |
| 1 | 16.5 | 114 | 12.5 | 86 | 9.5 | 66 | 6.9 | 48 | ||
| R | 26 | 179 | 20 | 138 | 14.0 | 97 | 9.8 | 68 | ||
| 1600 | 871 | 0.5 | 10.3 | 71 | 7.6 | 52 | 5.6 | 39 | 4.0 | 28 |
| 1 | 11.7 | 81 | 9.0 | 62 | 6.2 | 43 | 4.3 | 30 | ||
| R | 20 | 138 | 13.7 | 94 | 9.5 | 66 | 6.2 | 43 | ||
| 1700 | 927 | 0.5 | 7.8 | 54 | 5.7 | 39 | 3.9 | 27 | 2.5 | 17 |
| 1 | 8.8 | 61 | 6.8 | 47 | 4.5 | 31 | 2.7 | 19 | ||
| R | 15.0 | 103 | 10.0 | 69 | 6.0 | 41 | 3.6 | 25 | ||
| 1800 | 982 | 0.5 | 5.8 | 40 | 3.5 | 24 | 1.8 | 12 | 0.90 | 6.2 |
| 1 | 6.3 | 43 | 4.0 | 28 | 2.1 | 14 | 1.1 | 7.6 | ||
| R | 9.4 | 65 | 6.0 | 41 | 3.2 | 33 | 1.7 | 12 | ||
| 1900 | 1038 | 0.5 | 4.0 | 28 | 2.0 | 14 | 0.90 | 6.2 | — | — |
| 1 | 4.4 | 30 | 2.2 | 15 | 1.0 | 6.9 | 0.50* | 3.4* | ||
| R | 7.0 | 48 | 3.7 | 26 | 1.8 | 12 | 1.0 | 6.9 | ||
| 2000 | 1093 | 0.5 | 1.9 | 13 | 0.80 | 5.5 | 0.35 | 2.4 | — | — |
| 1 | 2.3 | 16 | 1.0 | 6.9 | 0.47 | 3.2 | 0.20* | 1.4* | ||
| R | 4.2 | 29 | 2.1 | 14 | 1.0 | 6.9 | 0.55 | 3.8 | ||
| 2100 | 1149 | 0.5 | 0.80 | 5.5 | 0.03* | 2.1* | — | — | — | — |
| 1 | 1.0 | 6.9 | 0.43 | 3.0 | — | — | — | — | ||
| R | 2.3 | 16 | 1.2 | 8.3 | 0.60 | 4.1 | — | — | ||
*Significant Extrapolation
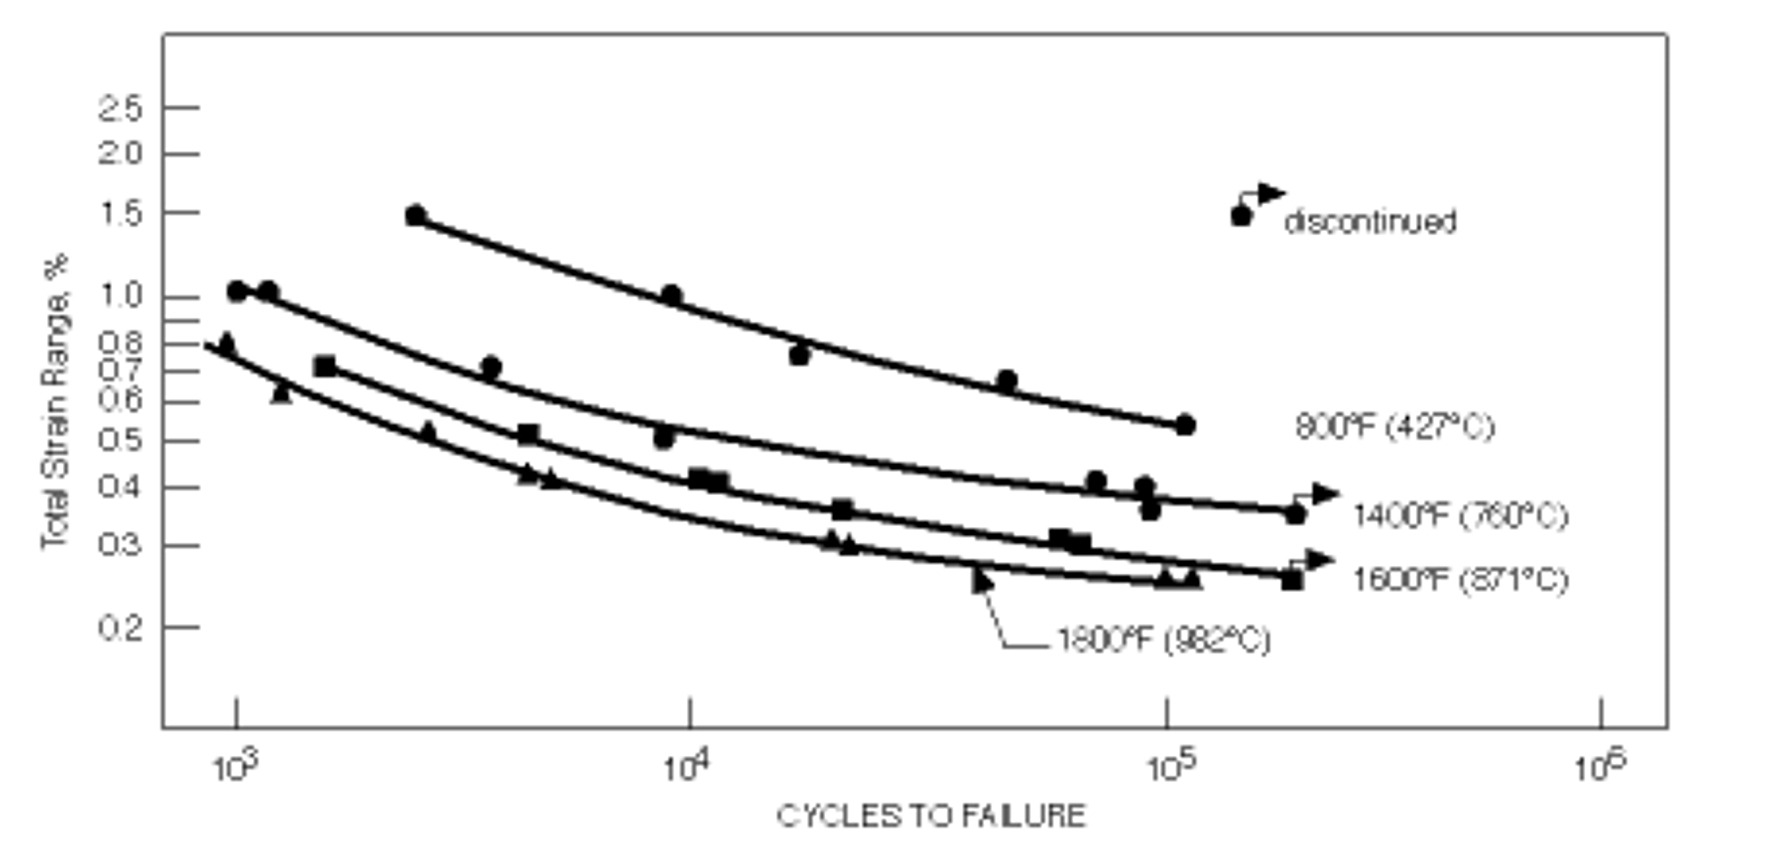
| Temperature | Δεtot/% | Ni, Cycles to Initiation | Nf, Cycles to Failure | |
| °F | °C | |||
| 800 | 427 | 1.50 | 2230 | 2398 |
| 1.00 | 8480 | 8742 | ||
| 0.80 | 14,918 | 16,575 | ||
| 0.65 | 45,124 | 46,523 | ||
| 0.55 | 103,910 | 115,456 | ||
| 1000 | 538 | 1.50 | 1329 | 1540 |
| 1.25 | 1974 | 2368 | ||
| 1.00 | 3330 | 4413 | ||
| 0.80 | 7864 | 8734 | ||
| 0.70 | 8423 | 9876 | ||
| 0.60 | 38,696 | 40,604 | ||
| 0.56 | 73,014 | 74,132 | ||
| 0.53 | — | 200,005* | ||
| 0.50 | — | 201,190* | ||
| 1200 | 649 | 1.25 | 1022 | 1257 |
| 1.00 | 1852 | 2254 | ||
| 0.80 | 3431 | 4248 | ||
| 0.60 | 8962 | 11,058 | ||
| 0.50 | 82,275 | 85,563 | ||
| 0.45 | — | 200,002* | ||
| 0.40 | — | 200,005* | ||
| 1400 | 760 | 0.80 | 1896 | 2218 |
| 0.40 | 20,519 | 21,564 | ||
| 0.40 | 43,915 | 45,279 | ||
| 0.30 | — | 203,327* | ||
| 1400 | 760 | 1.00 | 870 | 1097 |
| 1.00 | 827 | 990 | ||
| 0.70 | 3166 | 3622 | ||
| 0.50 | 8153 | 8490 | ||
| 0.40 | 51,285 | 57,819 | ||
| 0.40 | 68,451 | 75,470 | ||
| 0.38 | 95,165 | 96,844 | ||
| 0.37 | 91,879 | 97,612 | ||
| 0.35 | — | 202,920* | ||
| 0.30 | — | 150,000* | ||
| 1600 | 871 | 0.70 | 1279 | 1504 |
| 0.50 | 3939 | 4299 | ||
| 0.50 | 3176 | 3473 | ||
| 0.40 | 9712 | 10,837 | ||
| 0.40 | 9296 | 10,781 | ||
| 0.35 | 19,179 | 20,964 | ||
| 0.31 | 61,898 | 63,253 | ||
| 0.30 | 65,691 | 66,926 | ||
| 0.25 | — | 200,770* | ||
| 1800 | 982 | 0.60 | 818 | 1218 |
| 0.50 | 1506 | 2582 | ||
| 0.40 | 3520 | 4223 | ||
| 0.40 | 3070 | 4784 | ||
| 0.30 | 19,810 | 21,311 | ||
| 0.30 | 13,904 | 19,200 | ||
| 0.25 | 105,140 | 106,020 | ||
| 0.25 | 116,960 | 119,890 | ||
*Indicates a run-out
| Condition | 0.2% Yield Strength | Ultimate Tensile Strength | Elongation | R.A. | Impact Strength |
| ksi | ksi | % | % | ft-lb | |
| MA | 58.4 | 123.1 | 50 | 47.2 | 54 |
| +1200/8,000 hr. | 57.9 | 128.0 | 36.4 | 39 | 31.4 |
| +1200/20,000 hr. | 57.6 | 128.4 | 34.8 | 37 | 28.9 |
| +1200/30,000 hr. | 59.4 | 129.9 | 34 | 38.3 | — |
| +1200/50,000 hr. | 61.2 | 131.7 | 33.9 | 36.9 | 25.8 |
| +1400/8,000 hr. | 59.2 | 129.7 | 32 | 34.3 | 18.7 |
| +1400/20,000 hr. | 55.0 | 126.9 | 31.2 | 31.6 | 18.8 |
| +1400/30,000 hr. | 54.3 | 126.9 | 31.3 | 33.9 | — |
| +1400/50,000 hr. | 55.2 | 127.7 | 32.2 | 32.5 | 20.7 |
| +1600/8,000 hr. | 54.3 | 122.7 | 36.2 | 34.6 | 21.6 |
| +1600/20,000 hr. | 50.1 | 121.6 | 34.4 | 31.1 | 19.5 |
| +1600/30,000 hr. | 49.6 | 120.0 | 32.1 | 28.6 | — |
| +1600/50,000 hr. | 116.7 | 116.7 | 25.2* | 20.2 | 14.8 |
| Exposure Temperature | Room Temperature Tensile Elongation | |||
| 230 | 188 | 625 | X | |
| °F | % | % | % | % |
| 1200 | 36.4 | 29.1 | 18 | 19 |
| 1400 | 32 | 10.8 | 13 | 19 |
| 1600 | 36.2 | 22.2 | 26 | 30 |
| Form |
Hardness, HRBW | Typical ASTM Grain Size |
| Sheet | 92 | 4 – 6.5 |
| Plate | 92 | 3 – 5 |
| Bar | 90 | 3 – 5 |
HRBW = Hardness Rockwell “B”, Tungsten Indentor.
| Time Exposure | Grain Size for Alloys Exposed at Temperature for Various Times* | |||||
| HAYNES® 230® Alloy | HAYNES® 188 Alloy |
HASTELLOY® X Alloy | ||||
| h | 2150°F (1177°C) | 2200°F (1204°C) | 2150°F (1177°C) | 2200°F (1204°C) | 2150°F (1177°C) | 2200°F (1204°C) |
| 0 | 4 – 41/2 | 4 – 41/2 | 4 – 5 | 4 – 5 | 3 1/2 | 3 1/2 |
| 1 | 4 – 5 | 4 – 41/2 | 2 – 5 | 2 – 4 | 3 1/2 | 0 – 1 |
| 4 | 4 – 41/2 | 4 – 41/2 | 3 1/2 | 3 | 3 1/2 | 0 – 1 |
| 24 | 4 | 4 – 41/2 | 0 – 2 | 1 – 3 | 00 – 4 | 0 – 11/2 |
*Plate Product
| Alloy | 1600°F (870°C), 2000 h, 30-min cycles | 1800°F (980°C), 1000 h, 30-min cycles | 2000°F (1090°C), 500 h, 30-min cycles | 2100°F (1150°C), 200 h, 30-min cycles | ||||||||||||
| Metal Loss | Average Metal Affected | Metal Loss | Average Metal Affected | Metal Loss | Average Metal Affected | Metal Loss | Average Metal Affected | |||||||||
| mils | µm | mils | µm | mils | µm | mils | µm | mils | µm | mils | µm | mils | µm | mils | µm | |
| 188 | 1.1 | 28 | 2.9 | 74 | 1.1 | 28 | 3.2 | 81 | 10.9 | 277 | 13.1 | 333 | 8.0 | 203 | 9.7 | 246 |
| 230® | 0.9 | 23 | 3.9 | 99 | 2.8 | 71 | 5.6 | 142 | 7.1 | 180 | 9.9 | 251 | 6.4 | 163 | 13.1 | 333 |
| 617 | 2.0 | 51 | 7.8 | 198 | 2.4 | 61 | 5.7 | 145 | 13.3 | 338 | 20.9 | 531 | 13.8 | 351 | 15.3 | 389 |
| 625 | 1.2 | 30 | 2.2 | 56 | 3.7 | 94 | 6.0 | 152 | — | — | Consumed | — | — | — | — | |
| 556® | 1.5 | 38 | 3.9 | 99 | 4.1 | 104 | 6.7 | 170 | 9.9 | 251 | 12.1 | 307 | 11.5 | 292 | 14.0 | 356 |
| X | 1.7 | 43 | 5.3 | 135 | 4.3 | 109 | 7.3 | 185 | 11.6 | 295 | 14.0 | 356 | 13.9 | 353 | 15.9 | 404 |
| HR-120® | — | — | — | — | 6.3 | 160 | 8.3 | 211 | — | — | — | — | — | — | — | — |
| RA330 | 2.5 | 64 | 5.0 | 127 | 8.7 | 221 | 10.5 | 267 | 15.4 | 391 | 17.9 | 455 | 11.5 | 292 | 13.0 | 330 |
| HR-160® | — | — | — | — | 5.4 | 137 | 11.9 | 302 | 12.5 | — | 18.1 | 460 | 8.7 | 221 | 15.5 | 394 |
| 310SS | 6.0 | 152 | 7.9 | 201 | 16.0 | 406 | 18.3 | 465 | — | — | — | — | — | — | Consumed | |
| 800H | 3.9 | 99 | 9.4 | 239 | 22.9 | 582 | Through Thickness | — | — | Consumed after 300h | — | — | Consumed | |||
| Alloy | 1008 hours @ 1600F Cycled 1x/ week in air+10%H2 O | 1008 hours @ 1600F Cycled 1x/week in air+20%H2 O | 6 months @ 1400F Cycled 1x/ week in air+10%H2 O | |||||||||
| Metal Loss | Average Metal Affected | Metal Loss | Average Metal Affected | Metal Loss | Average Metal Affected | |||||||
| mils Per Side | mm Per Side | mils Per Side | mm Per Side | mils Per Side | mm Per Side | mils Per Side | mm Per Side | mils Per Side | mm Per Side | mils Per Side | mm Per Side | |
| 230® | 0.07 | 0.002 | 0.53 | 0.013 | 0.03 | 0.001 | 0.21 | 0.005 | 0.05 | 0.001 | 0.35 | 0.009 |
| 625 | 0.11 | 0.003 | 0.50 | 0.013 | 0.04 | 0.001 | 0.27 | 0.007 | — | — | — | — |
| X | 0.03 | 0.001 | 0.50 | 0.013 | 0.04 | 0.001 | 0.30 | 0.008 | — | — | — | — |
| 253MA | 0.66 | 0.017 | 1.59 | 0.040 | 0.08 | 0.002 | 0.68 | 0.017 | — | — | — | — |
| 800HT | — | — | — | — | — | — | — | — | 0.12 | 0.003 | 0.82 | 0.021 |
| 347SS | 0.86 | 0.022 | 1.48 | 0.038 | 0.18 | 0.005 | 0.18 | 0.005 | 0.46 | 0.012 | 1.26 | 0.032 |
| Alloy | 1600°F | 1800°F | 2000°F | 2100°F | ||||||||||||
| Metal Loss* | Average Metal Affected | Metal Loss* | Average Metal Affected | Metal Loss* | Average Metal Affected | Metal Loss* | Average Metal Affected | |||||||||
| mils | µm | mils | µm | mils | µm | mils | µm | mils | µm | mils | µm | mils | µm | mils | µm | |
| 625 | 0.3 | 8 | 1.4 | 36 | — | — | — | — | — | — | — | — | — | — | — | — |
| 230® | 0.2 | 5 | 1.4 | 36 | 0.1 | 3 | 2.5 | 64 | 3.4 | 86 | 11 | 279 | 28.5 | 724 | 34.4 | 874 |
| 617 | 0.3 | 8 | 1.6 | 41 | — | — | — | — | — | — | — | — | — | — | — | — |
| HR-120® | 0.3 | 8 | 1.6 | 41 | 0.5 | 13 | 3.3 | 84 | 18.1 | 460 | 23.2 | 589 | 33.6 | 853 | 44 | 1118 |
| 25 | 0.3 | 8 | 1.7 | 43 | — | — | — | — | — | — | — | — | — | — | — | — |
| 188 | 0.3 | 5 | 1.8 | 46 | — | — | — | — | — | — | — | — | — | — | — | — |
| 556® | 0.3 | 8 | 1.9 | 48 | 0.5 | 13 | 6.2 | 157 | 15 | 381 | 24.1 | 612 | — | — | — | — |
| X | 0.3 | 8 | 2.2 | 56 | 0.2 | 5 | 2.8 | 71 | 17.1 | 434 | 26.2 | 665 | 51.5 | 1308 | 55.4 | 1407 |
| 800HT | 0.4 | 10 | 2.9 | 74 | — | — | — | — | — | — | — | — | — | — | — | — |
| HR-160® | — | — | — | — | 1.7 | 43 | 13.7 | 348 | 7.2 | 183 | 30.8 | 782 | 12 | 305 | 45.6 | 1158 |
*Metal loss was calculated from final and initial metal thicknesses; i.e. ML = (OMT – FMT) /2
Alloy |
Comparative Oxidation Resistance in Flowing Air, 1008 Hours* | |||||||||||||||
| 1800°F (982°C) | 2000°F (1093°C) | 2100°F (1149°C) | 2200°F (1204°C) | |||||||||||||
| Metal Loss | Average Metal Affected | Metal Loss | Average Metal Affected | Metal Loss | Average Metal Affected | Metal Loss | Average Metal Affected | |||||||||
| mils | µm | mils | µm | mils | µm | mils | µm | mils | µm | mils | µm | mils | µm | mils | µm | |
| 230® | 0.2 | 5 | 1.5 | 38 | 0.5 | 13 | 3.3 | 84 | 1.2 | 30 | 4.4 | 112 | 4.7 | 119 | 8.3 | 211 |
| 188 | 0.1 | 3 | 1.1 | 28 | 0.5 | 13 | 3.7 | 94 | 8.6 | 218 | 10.7 | 272 | 5.2 | 132 | 48.2 | 1224 |
| 601 | 0.4 | 10 | 1.7 | 43 | 1.3 | 33 | 3.8 | 97 | 2.8 | 71 | 6.5 | 165 | 4.4 | 112 | 7.5 | 191 |
| 617 | 0.3 | 8 | 2.0 | 51 | 0.6 | 15 | 3.8 | 97 | 1.0 | 25 | 5.2 | 132 | 10.7 | 272 | 12.6 | 320 |
| X | 0.2 | 5 | 1.5 | 38 | 1.3 | 33 | 4.4 | 112 | 3.6 | 91 | 6.1 | 115 | — | — | — | — |
| 800HT | 0.5 | 13 | 4.1 | 104 | 7.6 | 193 | 11.6 | 295 | 12.4 | 315 | 15.0 | 381 | — | — | — | — |
| 446 SS | — | — | — | — | 13 | 330 | 14.4 | 366 | — | — | >21.5 | >546 | — | — | — | — |
| 316 SS | 12.3 | 312 | 14.2 | 361 | — | — | >17.5 | >445 | — | — | >17.5 | >445 | — | — | — | — |
*Metal Loss + Average Internal Penetration
| Alloy |
Nitrogen Absorption (mg/cm2) | ||
| 1800°F (982°C) | 2000°F (1093°C) | 2100°F (1149°C) | |
| 230® | 0.7 | 1.4 | 1.5 |
| 600 | 0.8 | 0.9 | 0.3 |
| 625 | 0.8 | 2.5 | 3.3 |
| X | 1.7 | 3.2 | 3.8 |
| RA330® | — | 3.9 | 3.1 |
| 800H | 4.3 | 4.0 | 5.5 |
| 316 SS | 6.9 | 6.0 | 3.3 |
| 310 SS | 7.4 | 7.7 | 9.5 |
| 304 SS | 9.8 | 7.3 | 3.5 |
| Test Temperature |
Hydrogen Pressure |
Ratio of Notched Tensile Strength, Hydrogen/Air | ||
| °F | °C | psig | MPa | |
| 70 | 21 | 3000 | 21 | 0.92 |
| 70 | 21 | 5000 | 34 | 1.07 |
Tests were performed in MIL-P-27201B grade hydrogen, with a crosshead speed of 0.005 in/min (0.13 mm/min). Specimens were notched with a KT value of 8.0.
| Alloy |
Corrosion Rate (mils per year) | ||
| 10% HNO3 Boiling | 10% H2SO4 150°F (66°C) | 10% HCl 150°F (66°C) | |
| 230® | 0.3 | 0.6 | 112 |
| 625 | 0.7 | 0.4 | 65 |
| 600 | 0.8 | 41.8 | 336 |
| 316 SS | 1 | 17.8 | 3408 |
| X | — | <0.1 | 99 |
HAYNES® 230® alloy is normally final solution heat-treated at 2250°F (1230°C) for a time commensurate with section thickness. Solution heat-treating can be performed at temperatures as low as about 2125°F (1165°C), but resulting material properties will be altered accordingly.
| Cold Reduction | Subsequent Anneal Temperature | 0.2% Offset Yield Strength | Ultimate Tensile Strength | Elongation | ||
| % | ksi | MPa | ksi | MPa | % | |
| 0 | None | 61.8 | 425 | 128.2 | 885 | 46.6 |
| 10 | 104 | 715 | 144.5 | 995 | 31.8 | |
| 20 | 133.4 | 920 | 163.9 | 1130 | 16.8 | |
| 30 | 160.1 | 1105 | 187.5 | 1295 | 9.7 | |
| 40 | 172.4 | 1190 | 201.5 | 1390 | 7.5 | |
| 50 | 184.6 | 1275 | 214.6 | 1480 | 6.0 | |
| 10 | 1950°F (1066°C) | 91.9 | 636 | 143.5 | 990 | 32.9 |
| 20 | 80.8 | 555 | 141.9 | 980 | 35.6 | |
| 30 | 75.9 | 525 | 142.1 | 980 | 35.7 | |
| 40 | 81.2 | 560 | 145.5 | 1005 | 32.3 | |
| 50 | 86.1 | 595 | 147.7 | 1020 | 34.6 | |
| 10 | 2050°F (1121°C) | 80.8 | 555 | 139.0 | 960 | 36.5 |
| 20 | 65.4 | 450 | 135.7 | 935 | 39.2 | |
| 30 | 72.0 | 495 | 140.0 | 965 | 37.6 | |
| 40 | 76.1 | 525 | 142.3 | 980 | 35.5 | |
| 50 | 80.8 | 555 | 143.9 | 990 | 36.3 | |
| 10 | 2150°F (1177°C) | 55.5 | 385 | 129.5 | 895 | 43.7 |
| 20 | 64.4 | 445 | 134.3 | 925 | 40.1 | |
| 30 | 70.2 | 485 | 138.1 | 950 | 38.5 | |
| 40 | 73.4 | 505 | 139.2 | 960 | 38.1 | |
| 50 | 71.9 | 495 | 137.7 | 950 | 39.1 | |
*Based upon rolling reductions taken upon 0.120-inch (3.0 mm) thick sheet. Duplicate tests.
| 0.2% Offset Yield Strength | Ultimate Tensile Strength | Elongation | Fracture Location |
||
| ksi | MPa | ksi | MPa | % | |
| 60.2 | 415 | 117.7 | 812 | 29.6 | Weld Metal |
| 58.4 | 403 | 113.4 | 782 | 28.2 | Weld Metal |
| Test Temperature | 0.2% Offset Yield Strength | Ultimate Tensile Strength | Elongation | Fracture Location |
|||
| °F | °C | ksi | MPa | ksi | MPa | % | |
| Room Temp. | 65.5 | 452 | 126.8 | 874 | 37.3 | Weld Metal | |
| 63.8 | 440 | 120.0 | 827 | 27.0 | Weld Metal | ||
| 1600 | 871 | 38.4 | 265 | 60.6 | 418 | 44.9 | Base Metal |
| 34.8 | 240 | 61.8 | 426 | 28.9 | Weld Metal | ||
| Ultimate Tensile Strength | Fracture Location |
|
| ksi | MPa | |
| 116 | 800 | Weld Metal |
| 117 | 807 | Weld Metal |
| 115 | 793 | Weld Metal |
| 116 | 800 | Weld Metal |
| Sample Location | 0.2% Offset Yield Strength | Ultimate Tensile Strength | Elongation | Reduction of Area | Fracture Location |
|||
| ksi | MPa | ksi | MPa | % | % | |||
| Weld Face | 74.1 | 511 | 109.5 | 755 | 27.2 | 30.9 | Weld Metal | |
| 74.6 | 514 | 110.7 | 763 | 34.8 | 44.4 | Weld Metal | ||
| Weld Center | 76.5 | 527 | 113.3 | 781 | 33.1 | 37.6 | Base Metal | |
| 76.8 | 530 | 111.2 | 767 | 26.7 | 32.9 | Weld Metal | ||
| Weld Root | 74.8 | 516 | 109.9 | 758 | 19.6 | 24.1 | Base Metal | |
| 74.0 | 510 | 115.0 | 793 | 31.0 | 41.3 | Weld Metal | ||
| Test Temperature | 0.2% Offset Yield Strength | Ultimate Tensile Strength | Elongation | |||
| °F | °C | ksi | MPa | ksi | MPa | % |
| RT | RT | 75.7 | 520 | 112.6 | 775 | 27.3 |
| 1800 | 980 | 21.2 | 145 | 22.7 | 155 | 24.6 |
Haynes® 230 excels in applications requiring strength, oxidation resistance and dimensional stability in prolonged high-temperature environments.
This material may also appear under the following names:
Haynes® 230 is a nickel-chromium-tungsten-molybdenum alloy that combines excellent high-temperature strength, outstanding resistance to oxidizing environments up to 2100°F (1149°C) for prolonged exposures, premier resistance to nitriding environments and excellent long-term thermal stability. It is readily fabricated and formed, and is castable. Other attractive features include lower thermal expansion characteristics than most high-temperature alloys and a pronounced resistance to grain coarsening with prolonged exposure to high temperatures.
The following are Haynes® 230’s chemical constituents according to ASTM standards:
This alloy’s composition meets ASTM standards for UNS N06230. For projects requiring unique material variants or proprietary chemistries, please include the details at the time of inquiry.
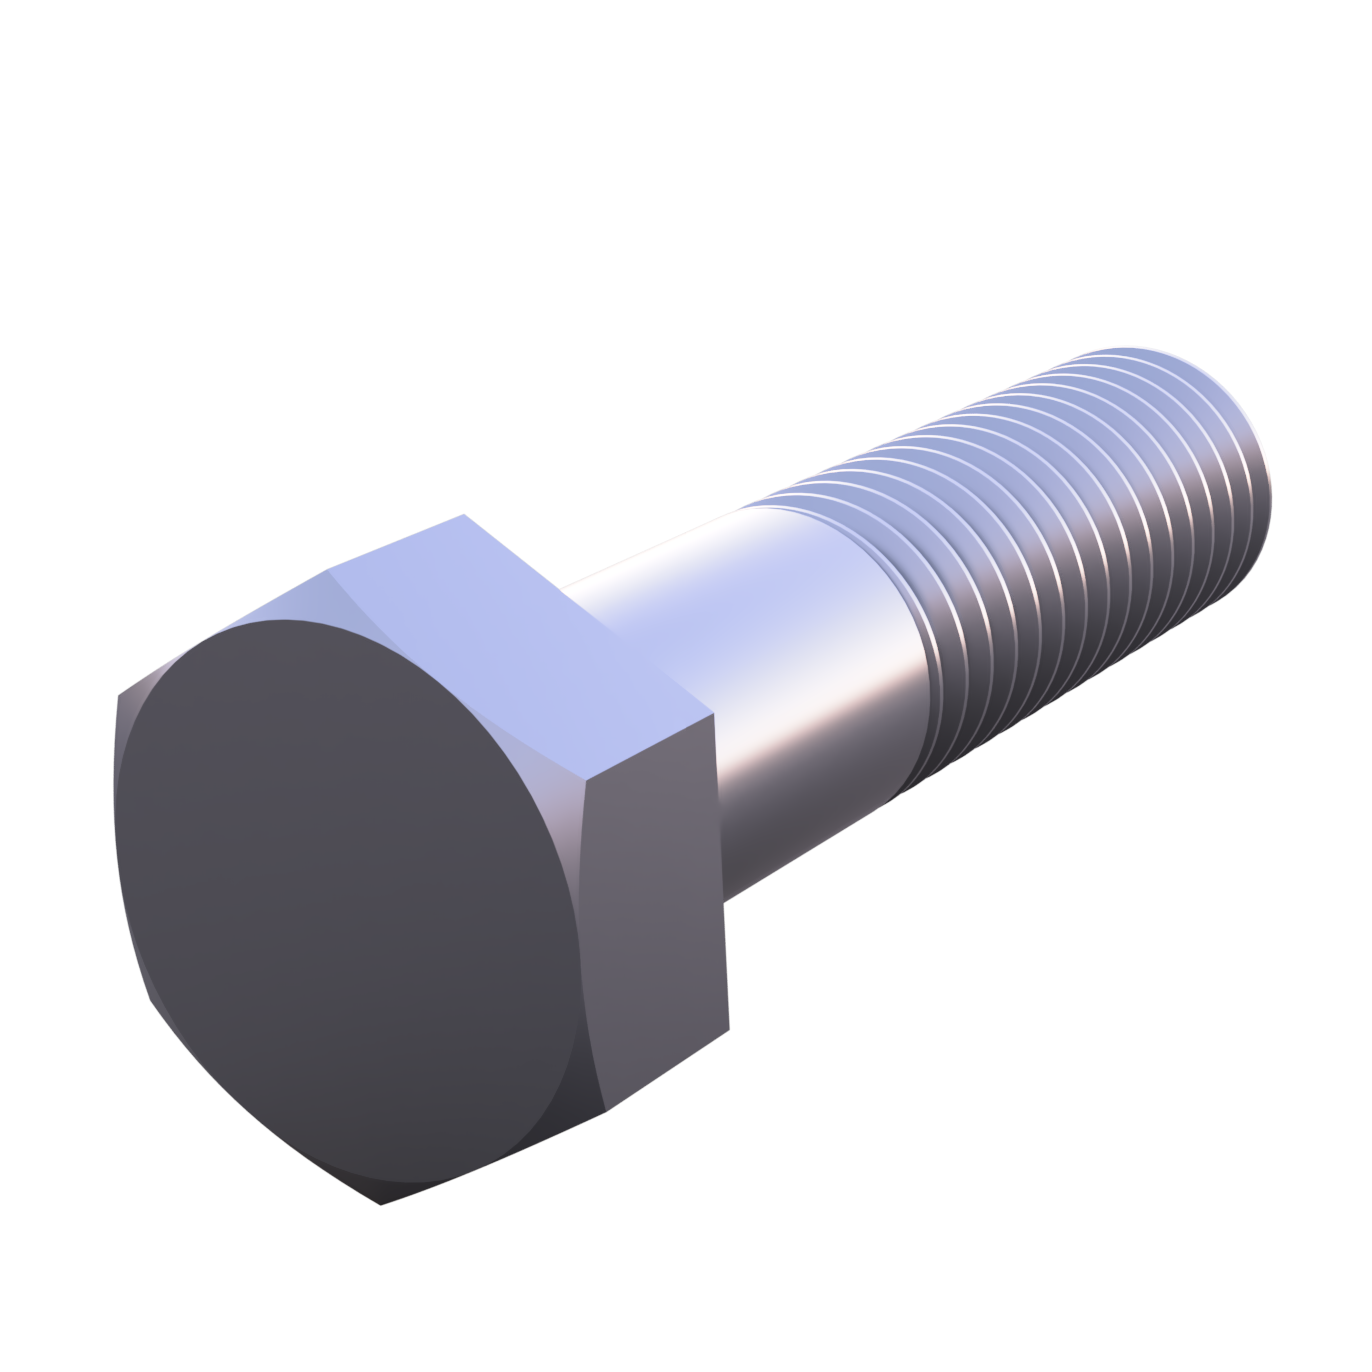
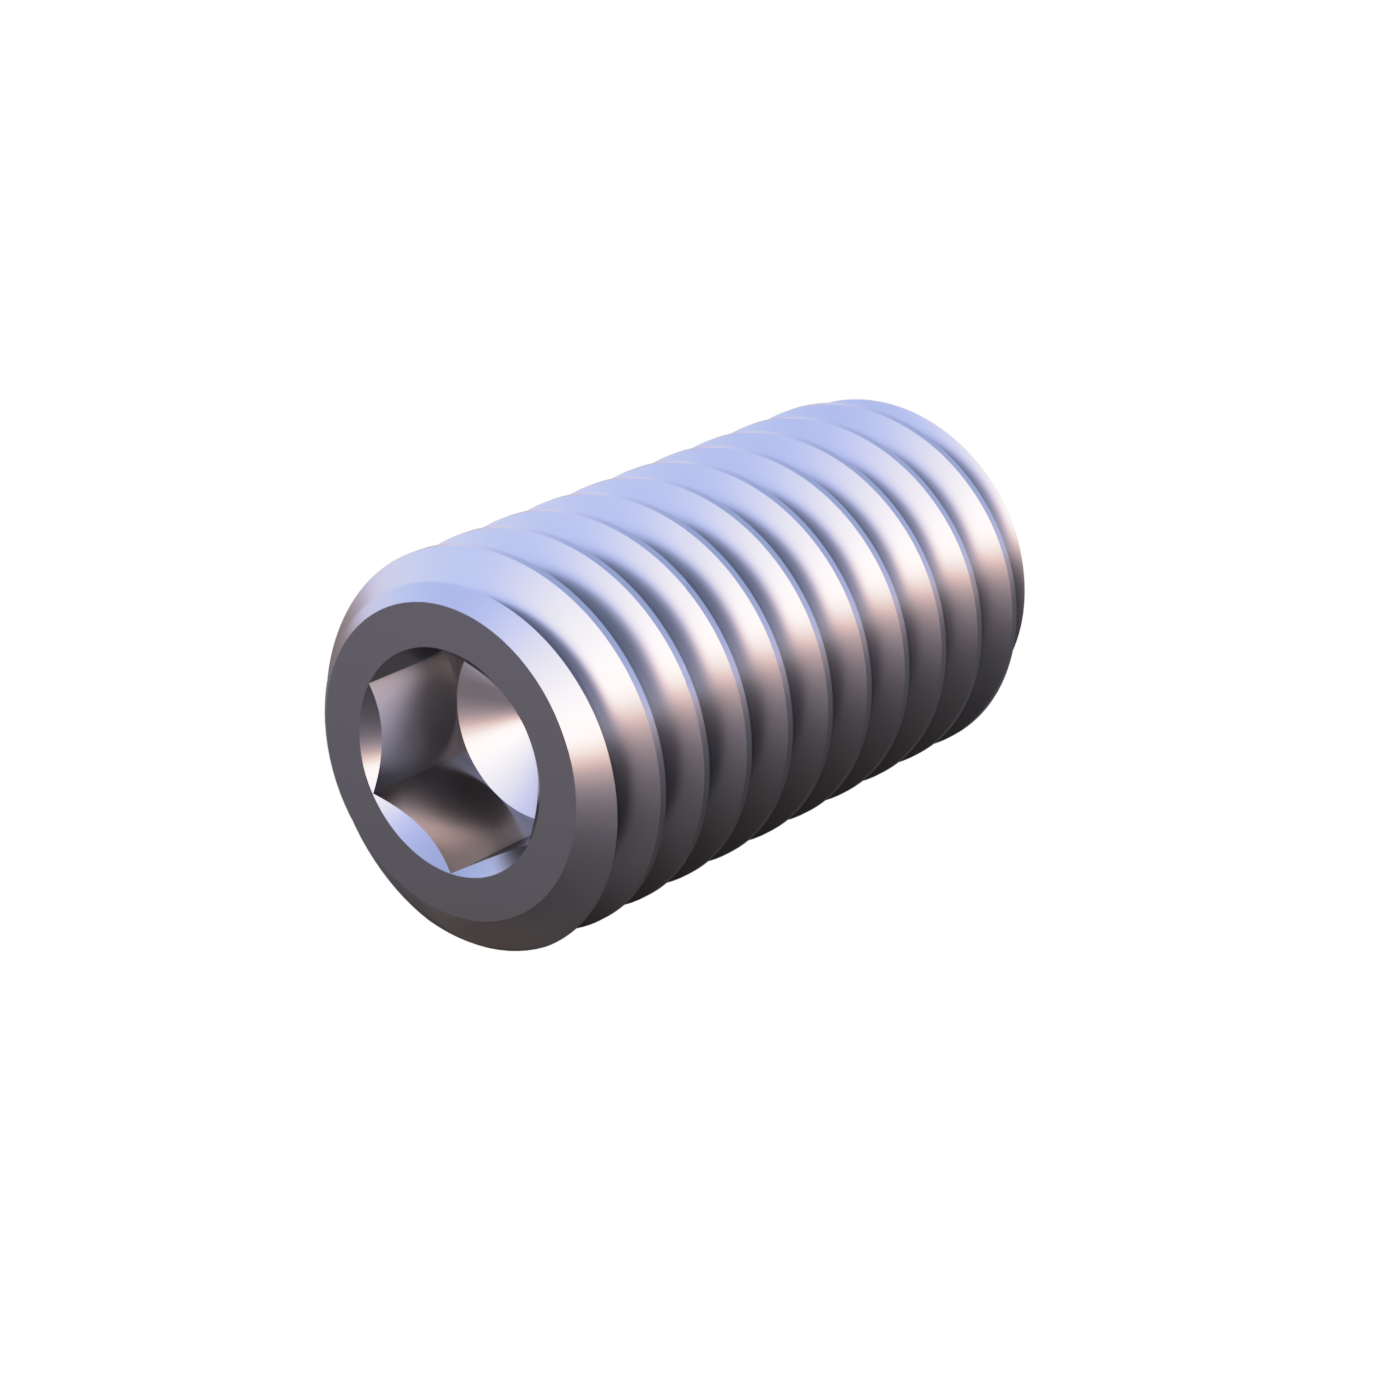
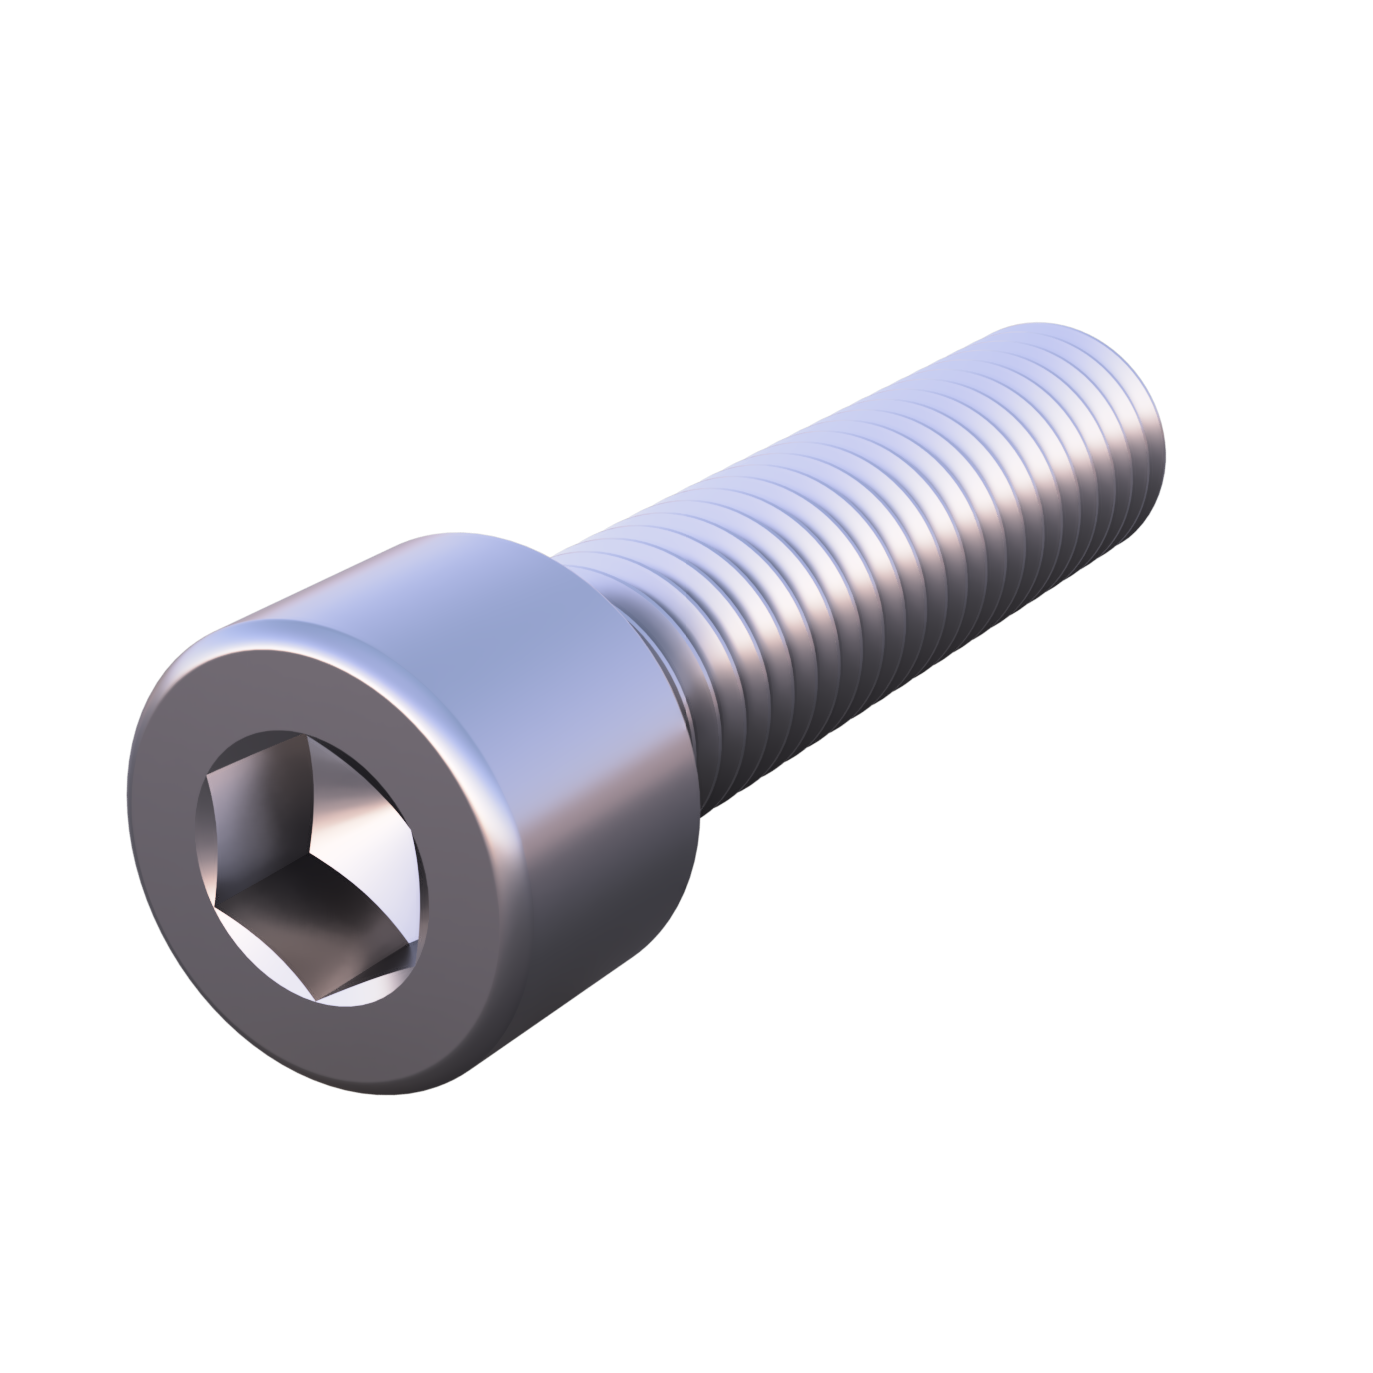
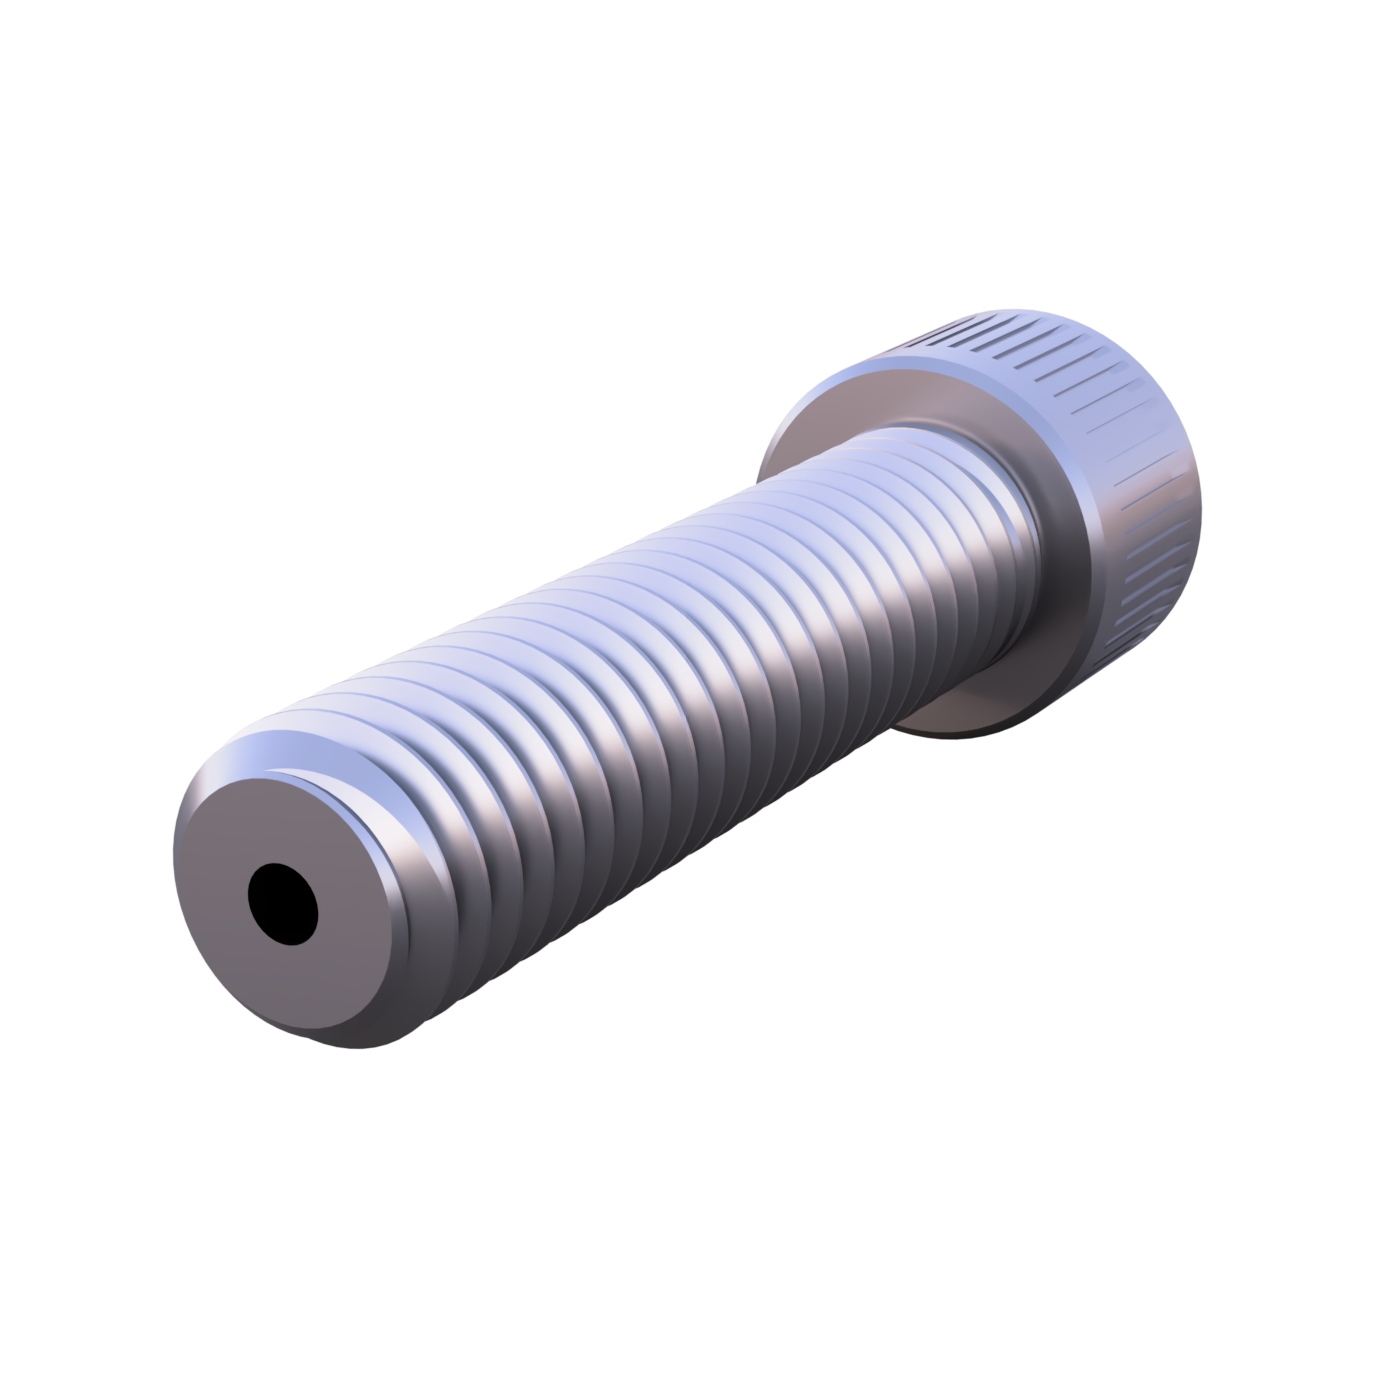
Fasteners made with Haynes® 230 alloy perform reliably in demanding industries, such as:
Nickel Systems stocks a comprehensive range of Haynes® 230 fasteners, including: